How to do a visual
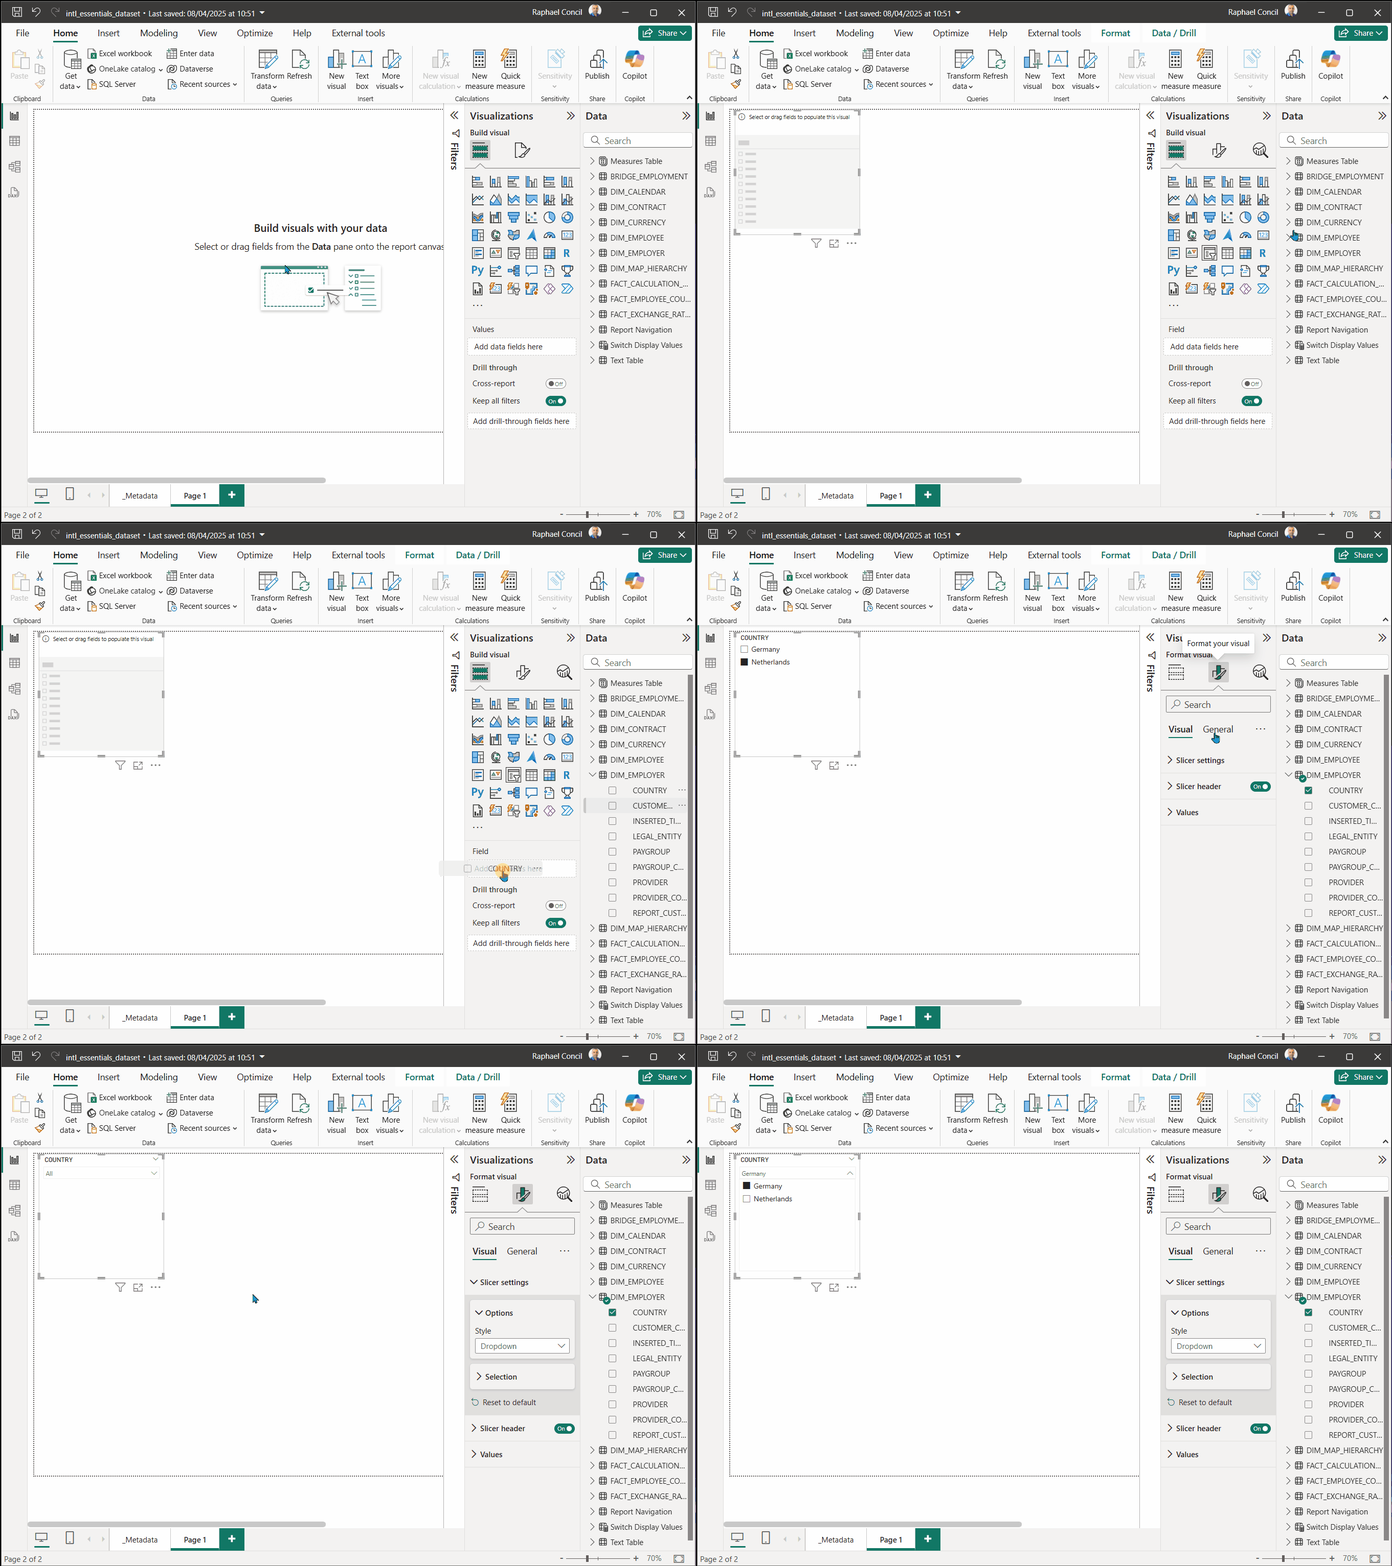
Slicer
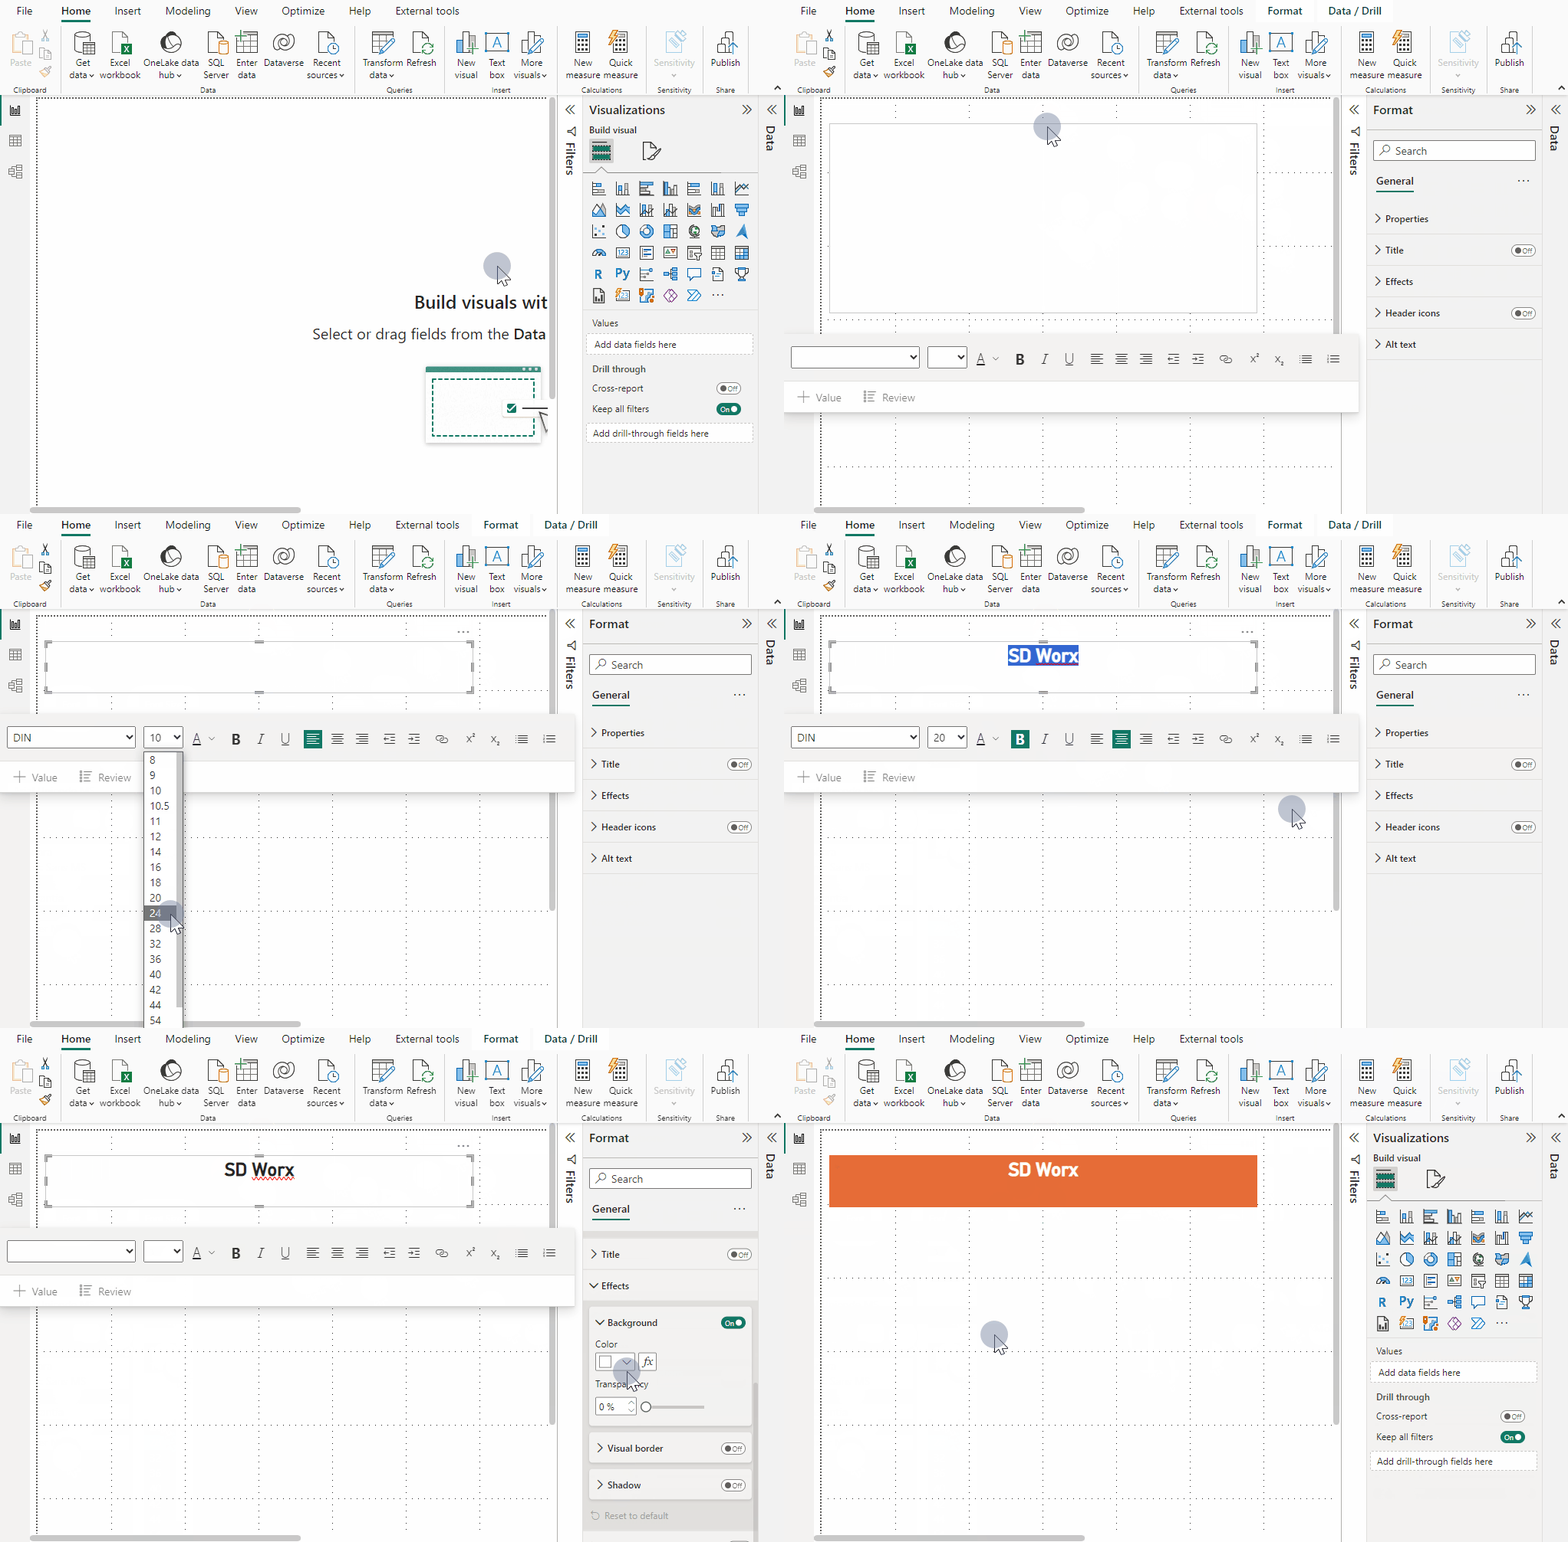
Text Box for titles
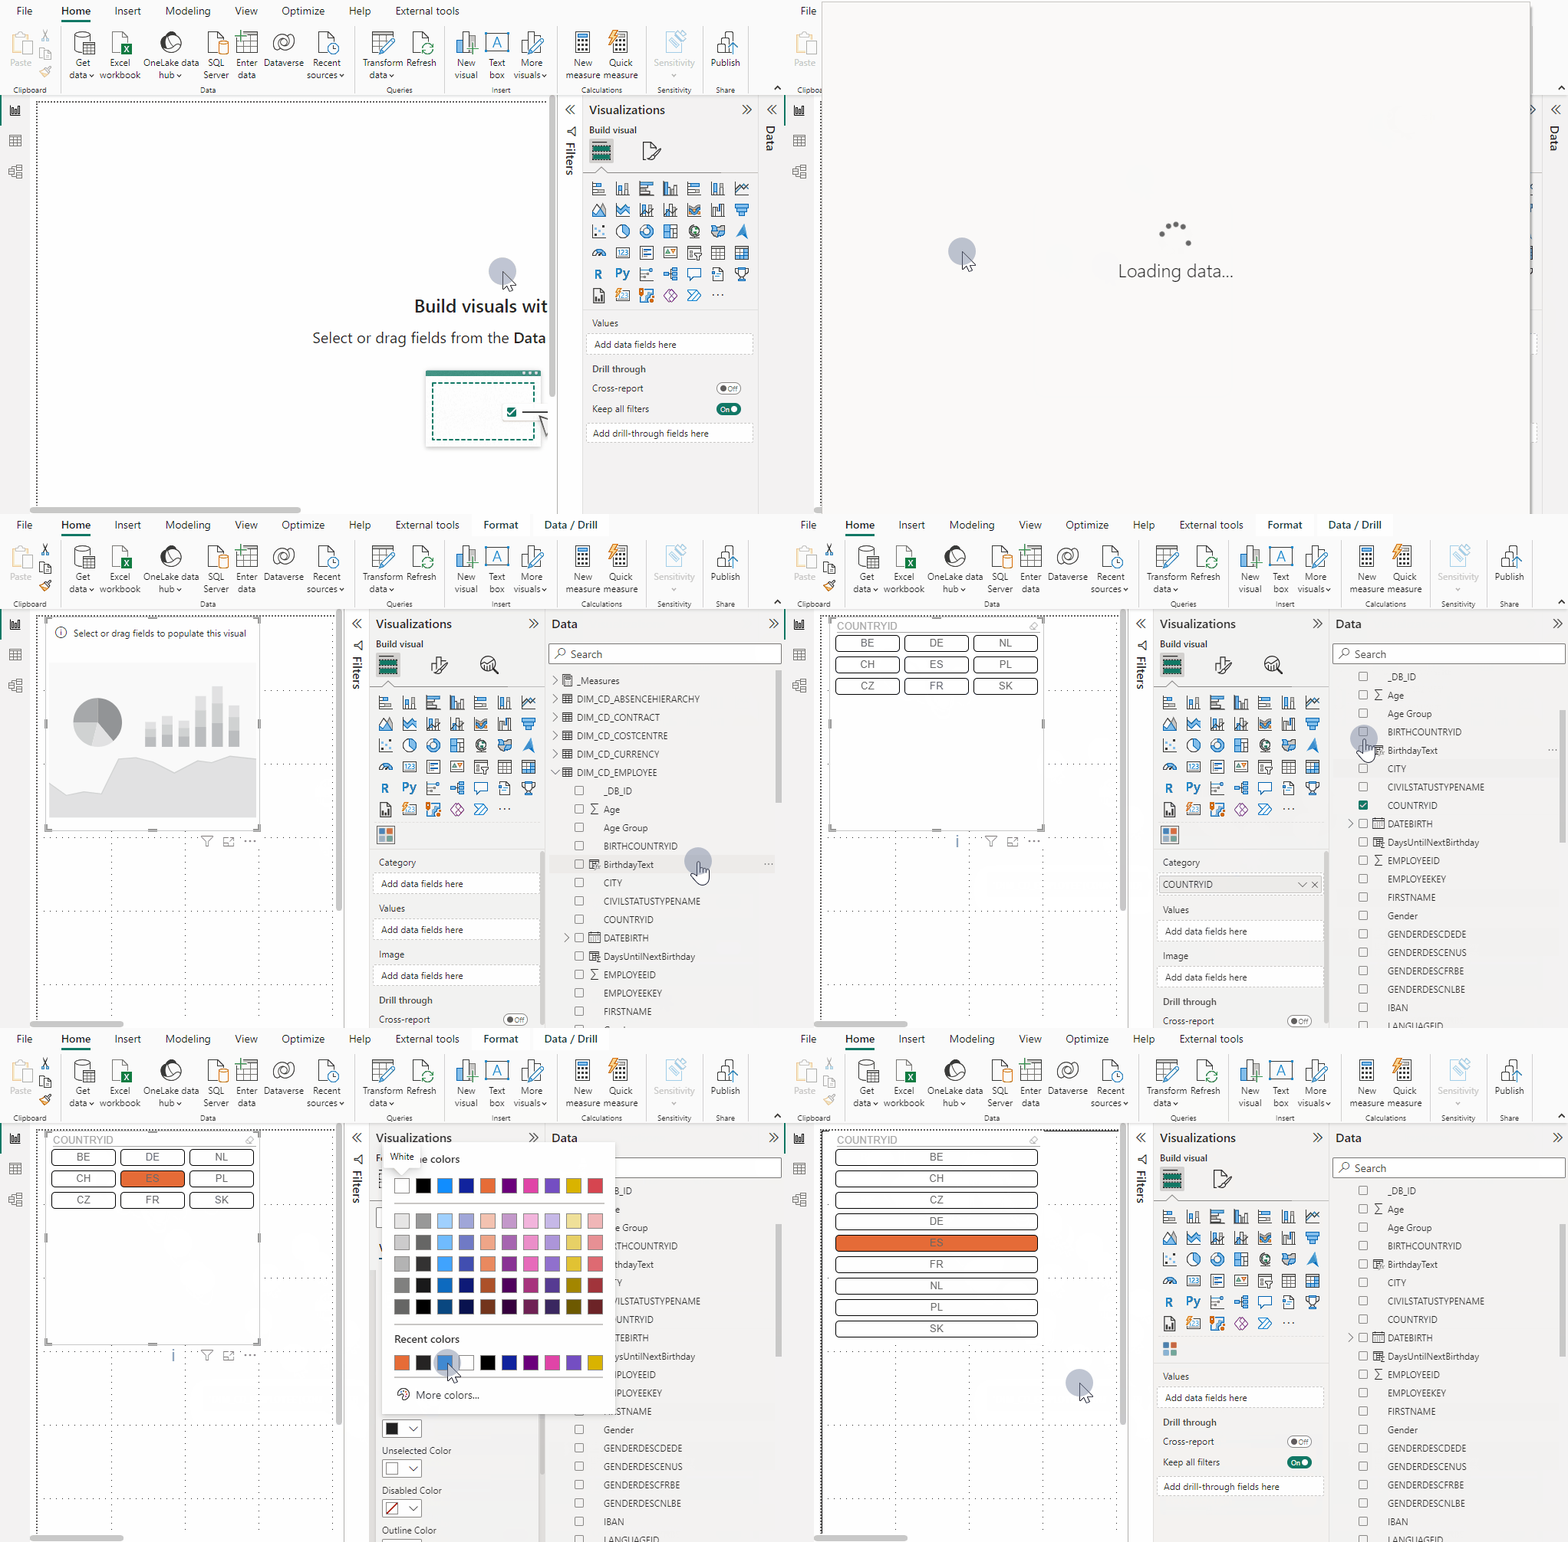
Chiclet Slicer
(If needed import this slicer by clicking more visuals)
Tables

Matrix
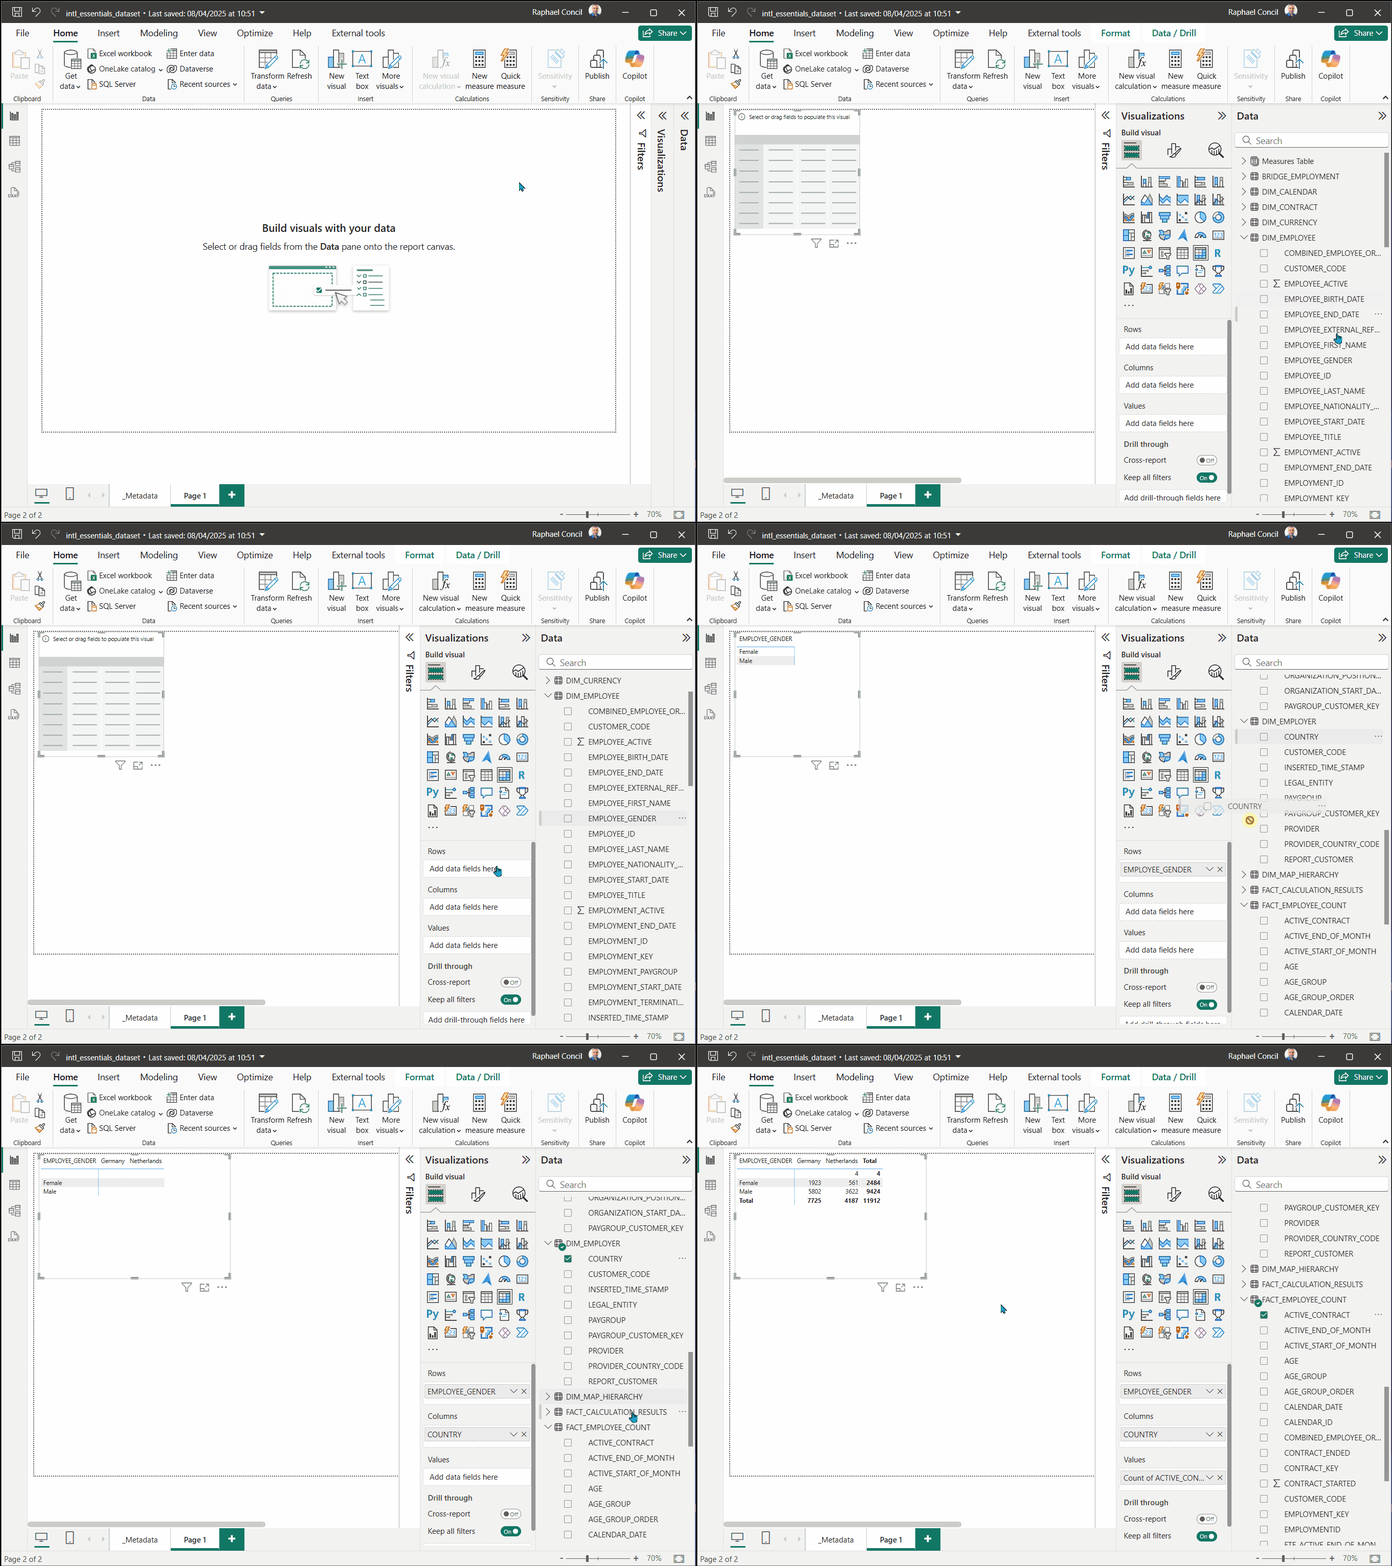
Need to pull fields for rows, columns and values
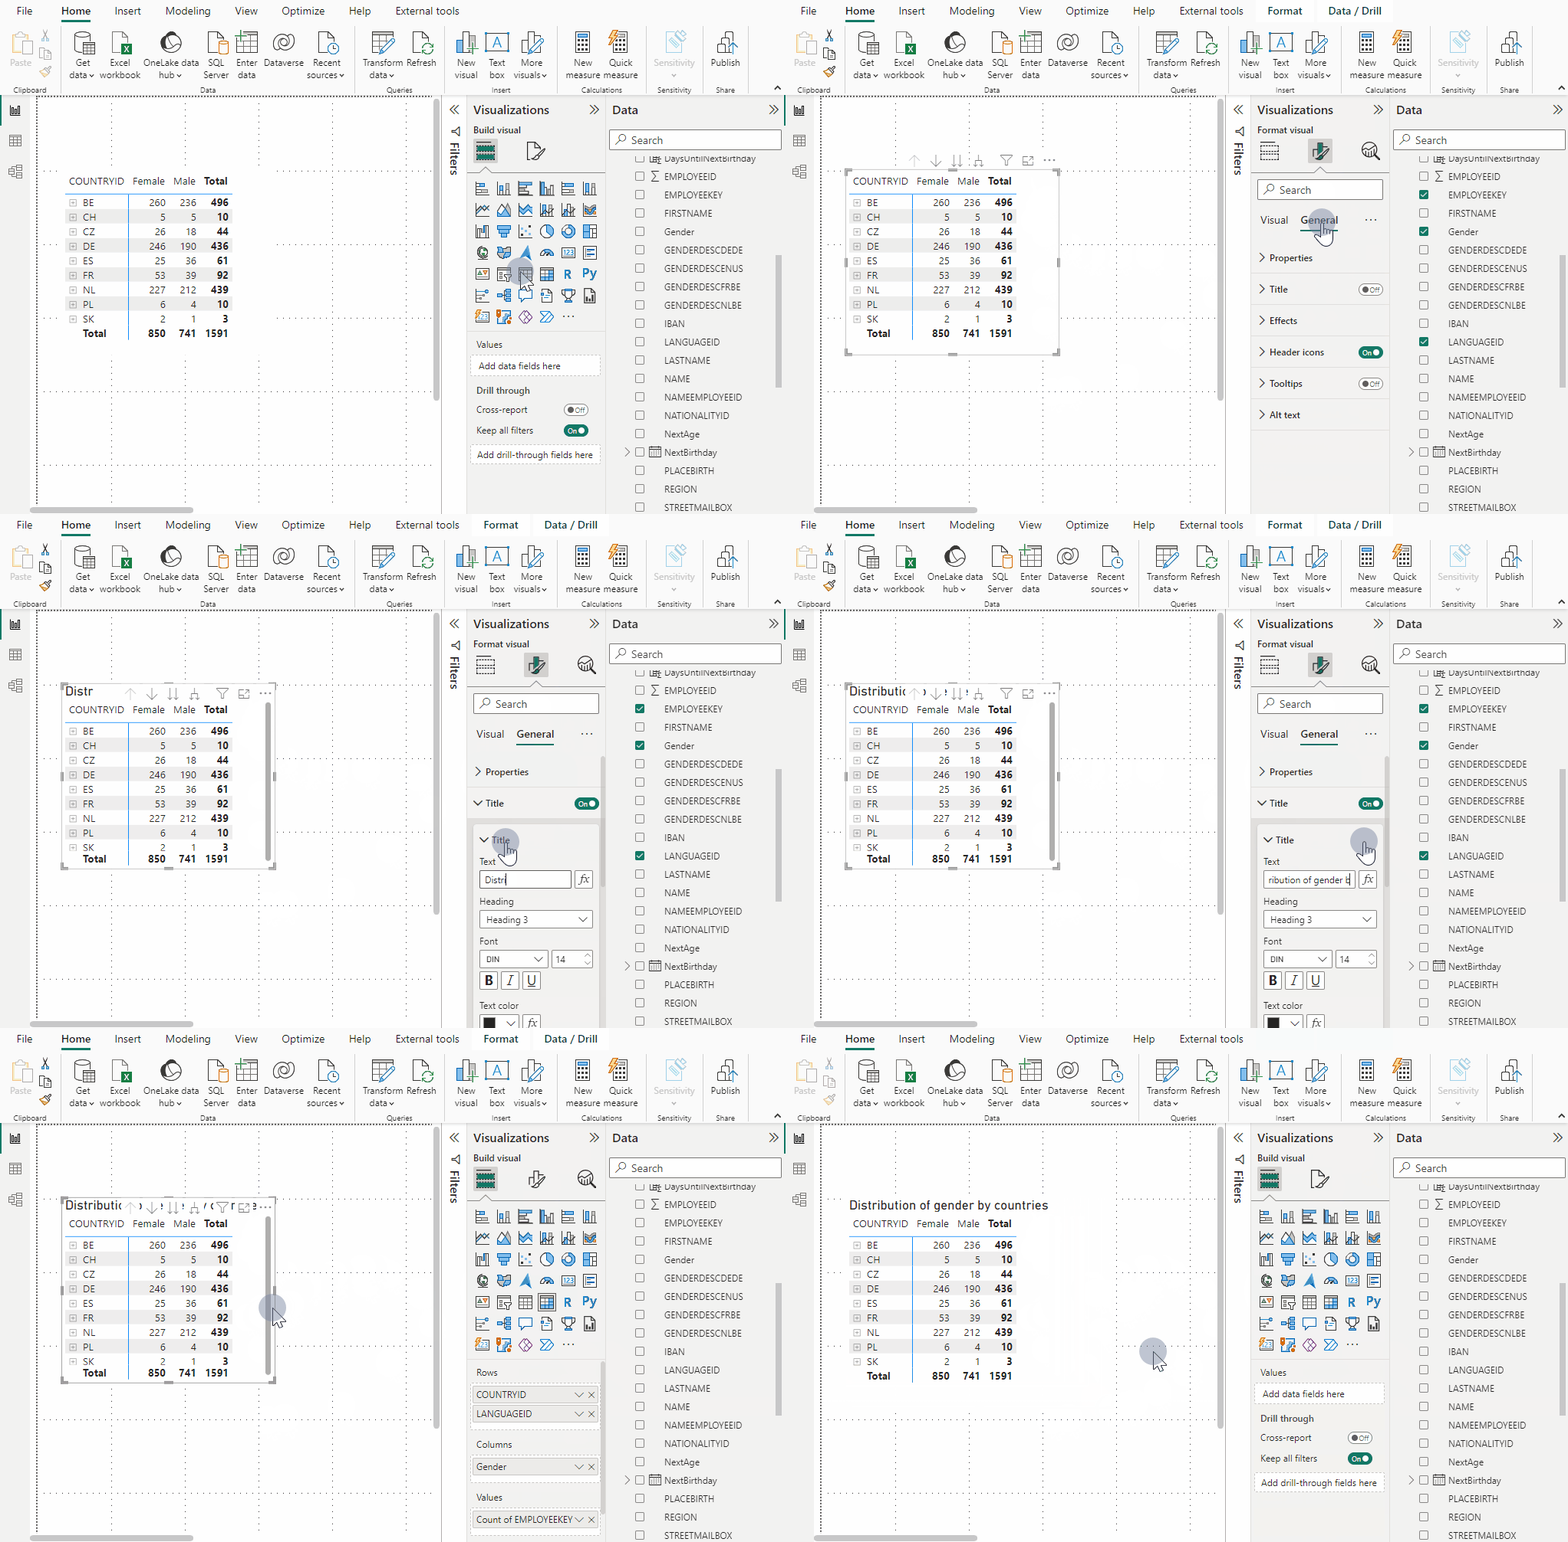
Visual Title
Click Format Visual => General to add titles.
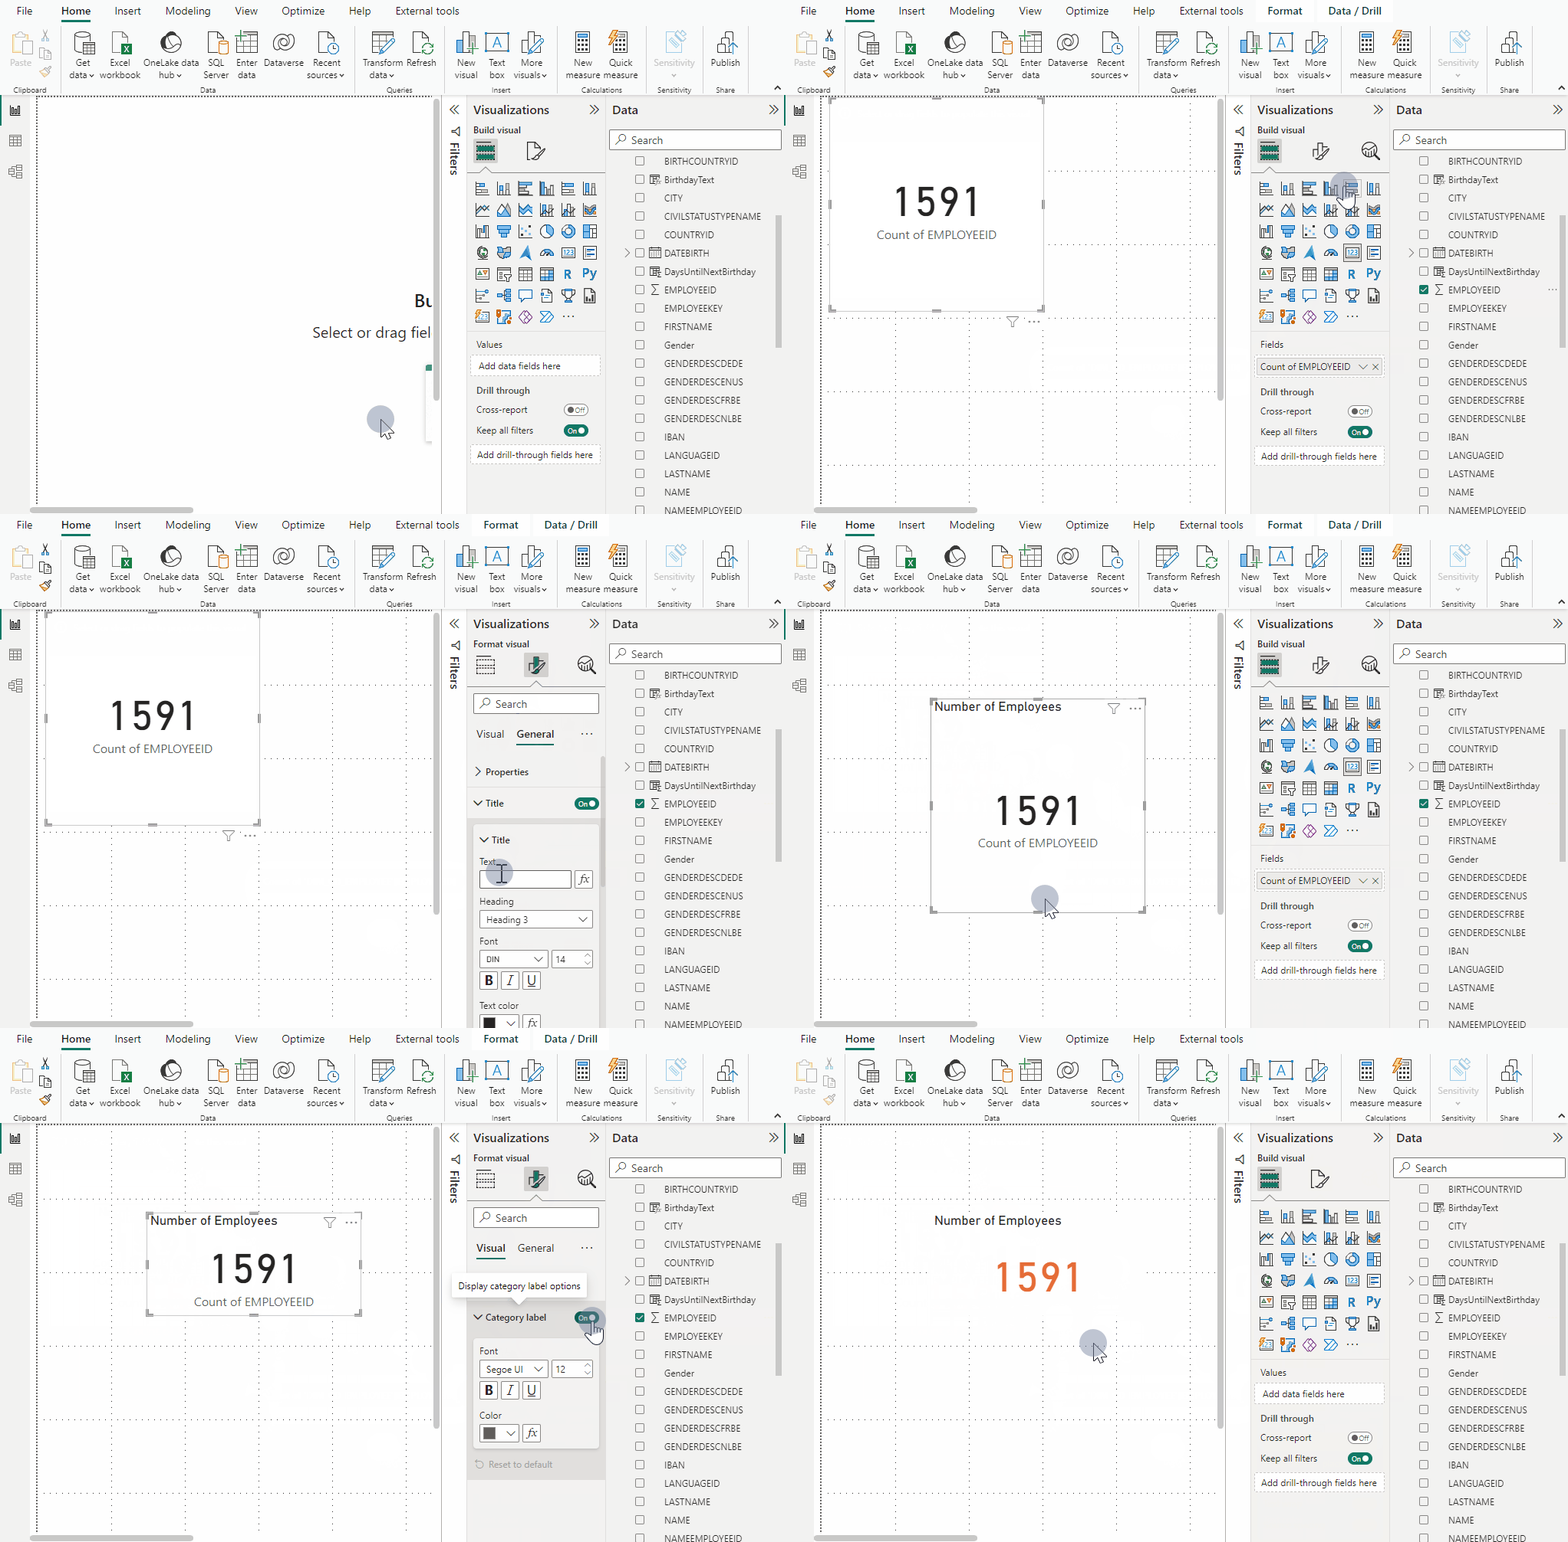
Card
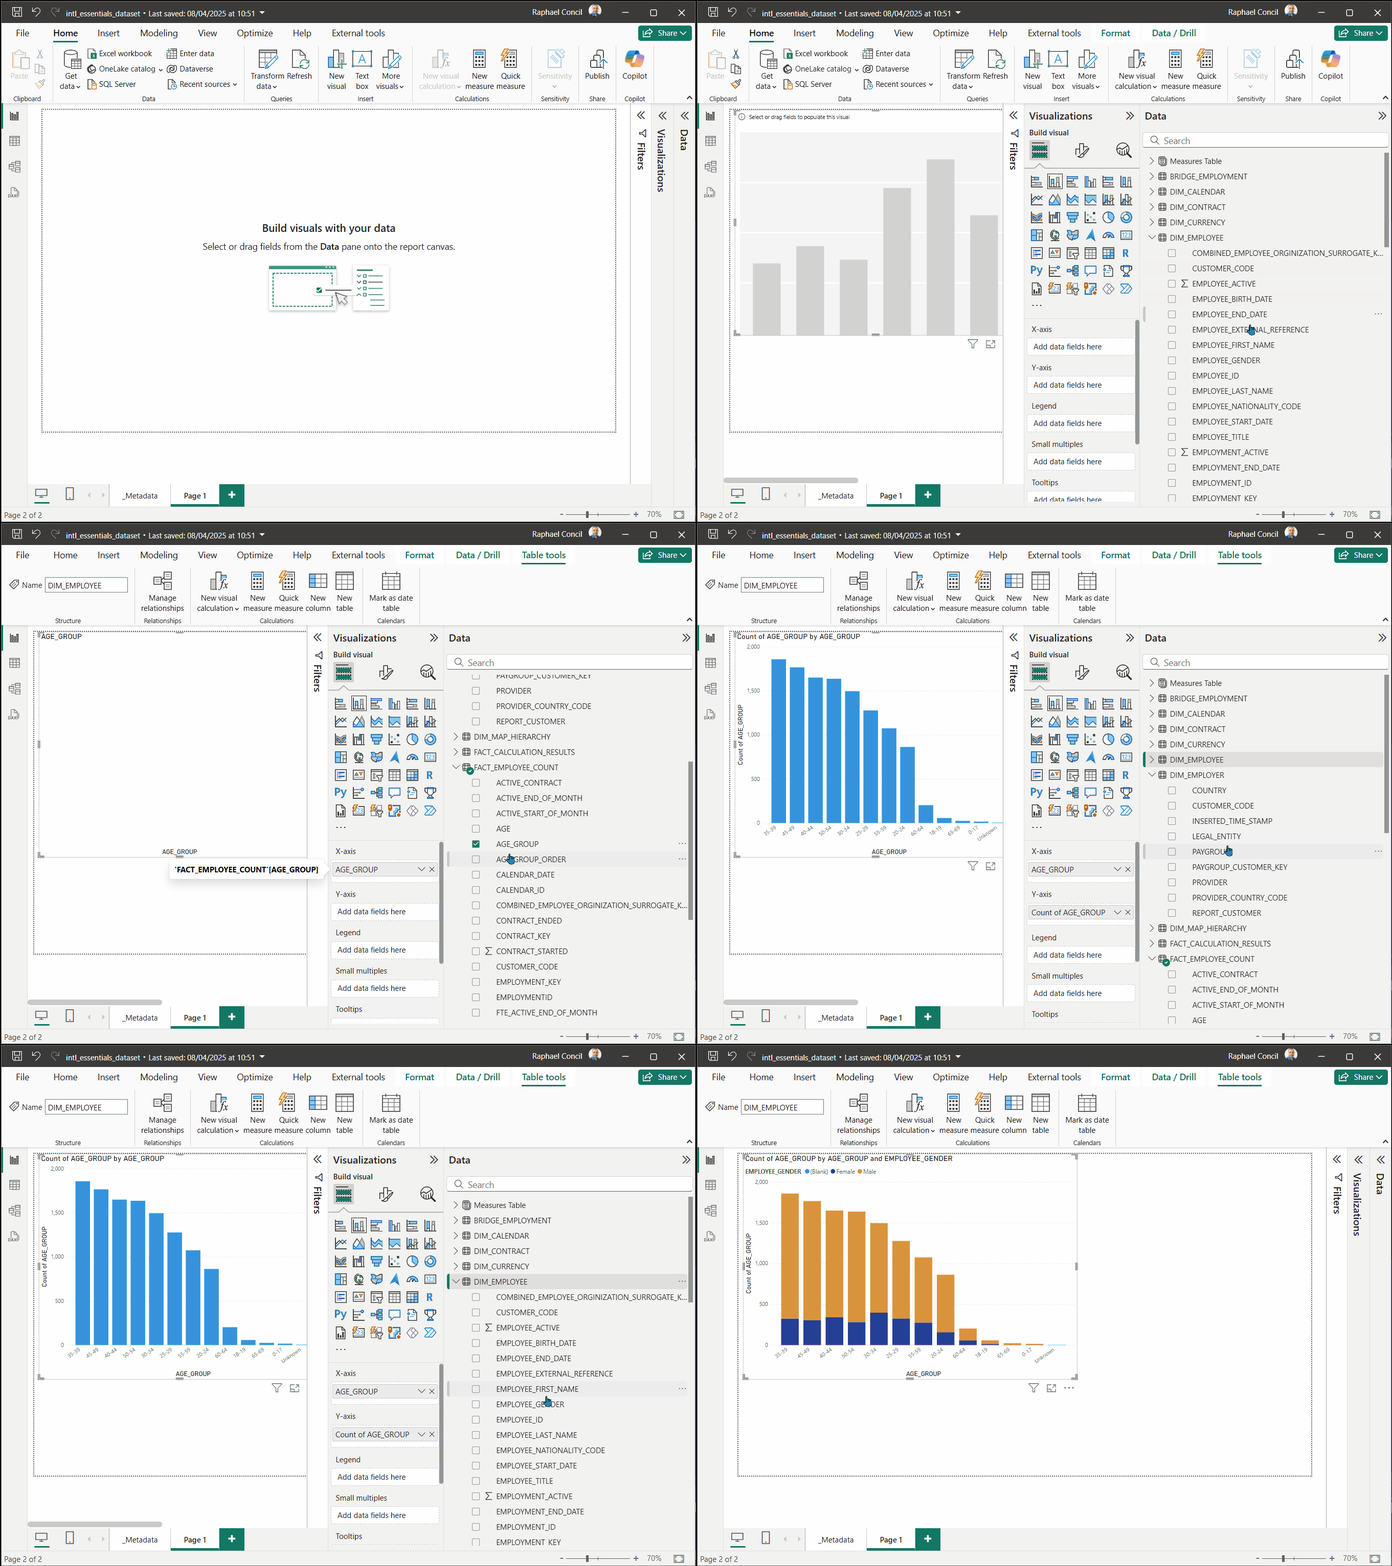
Stacked Column Chart
Donut Chart
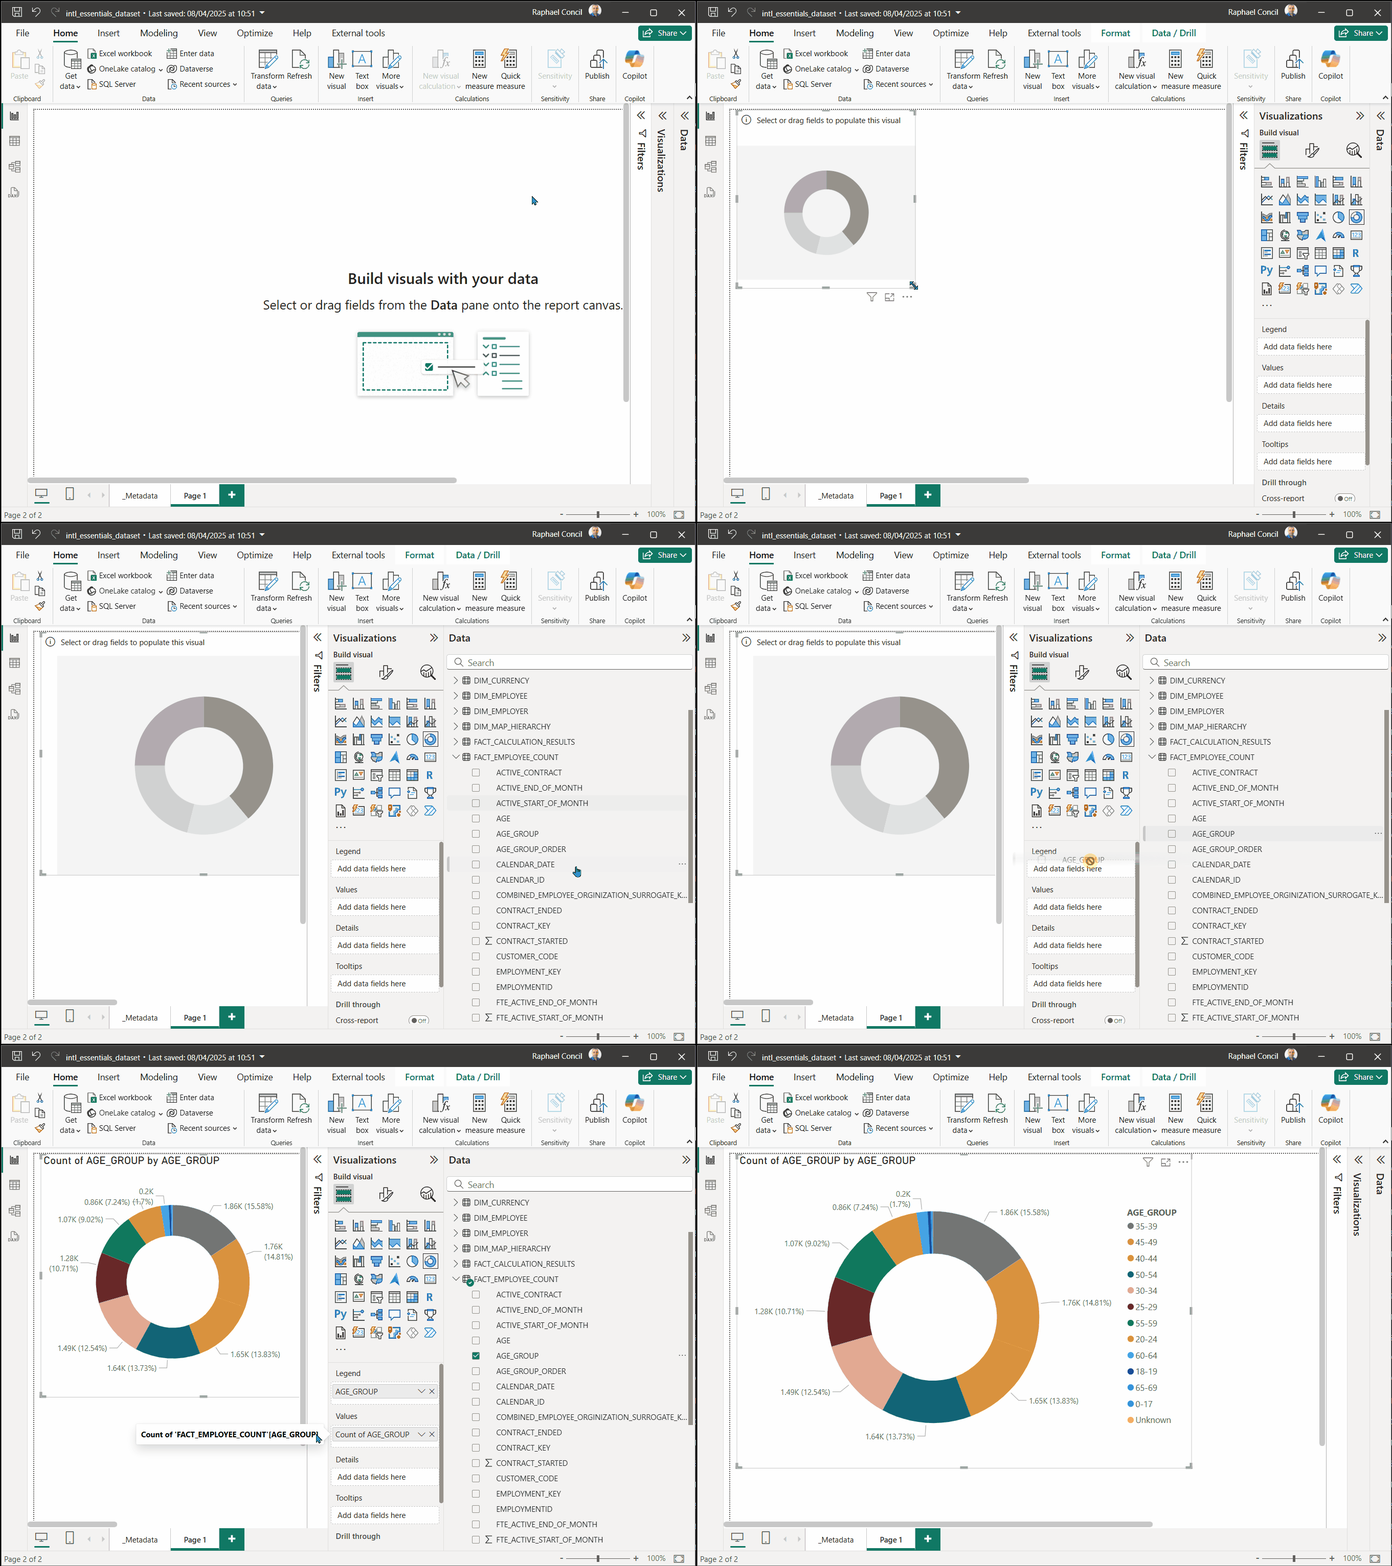
Pie chart
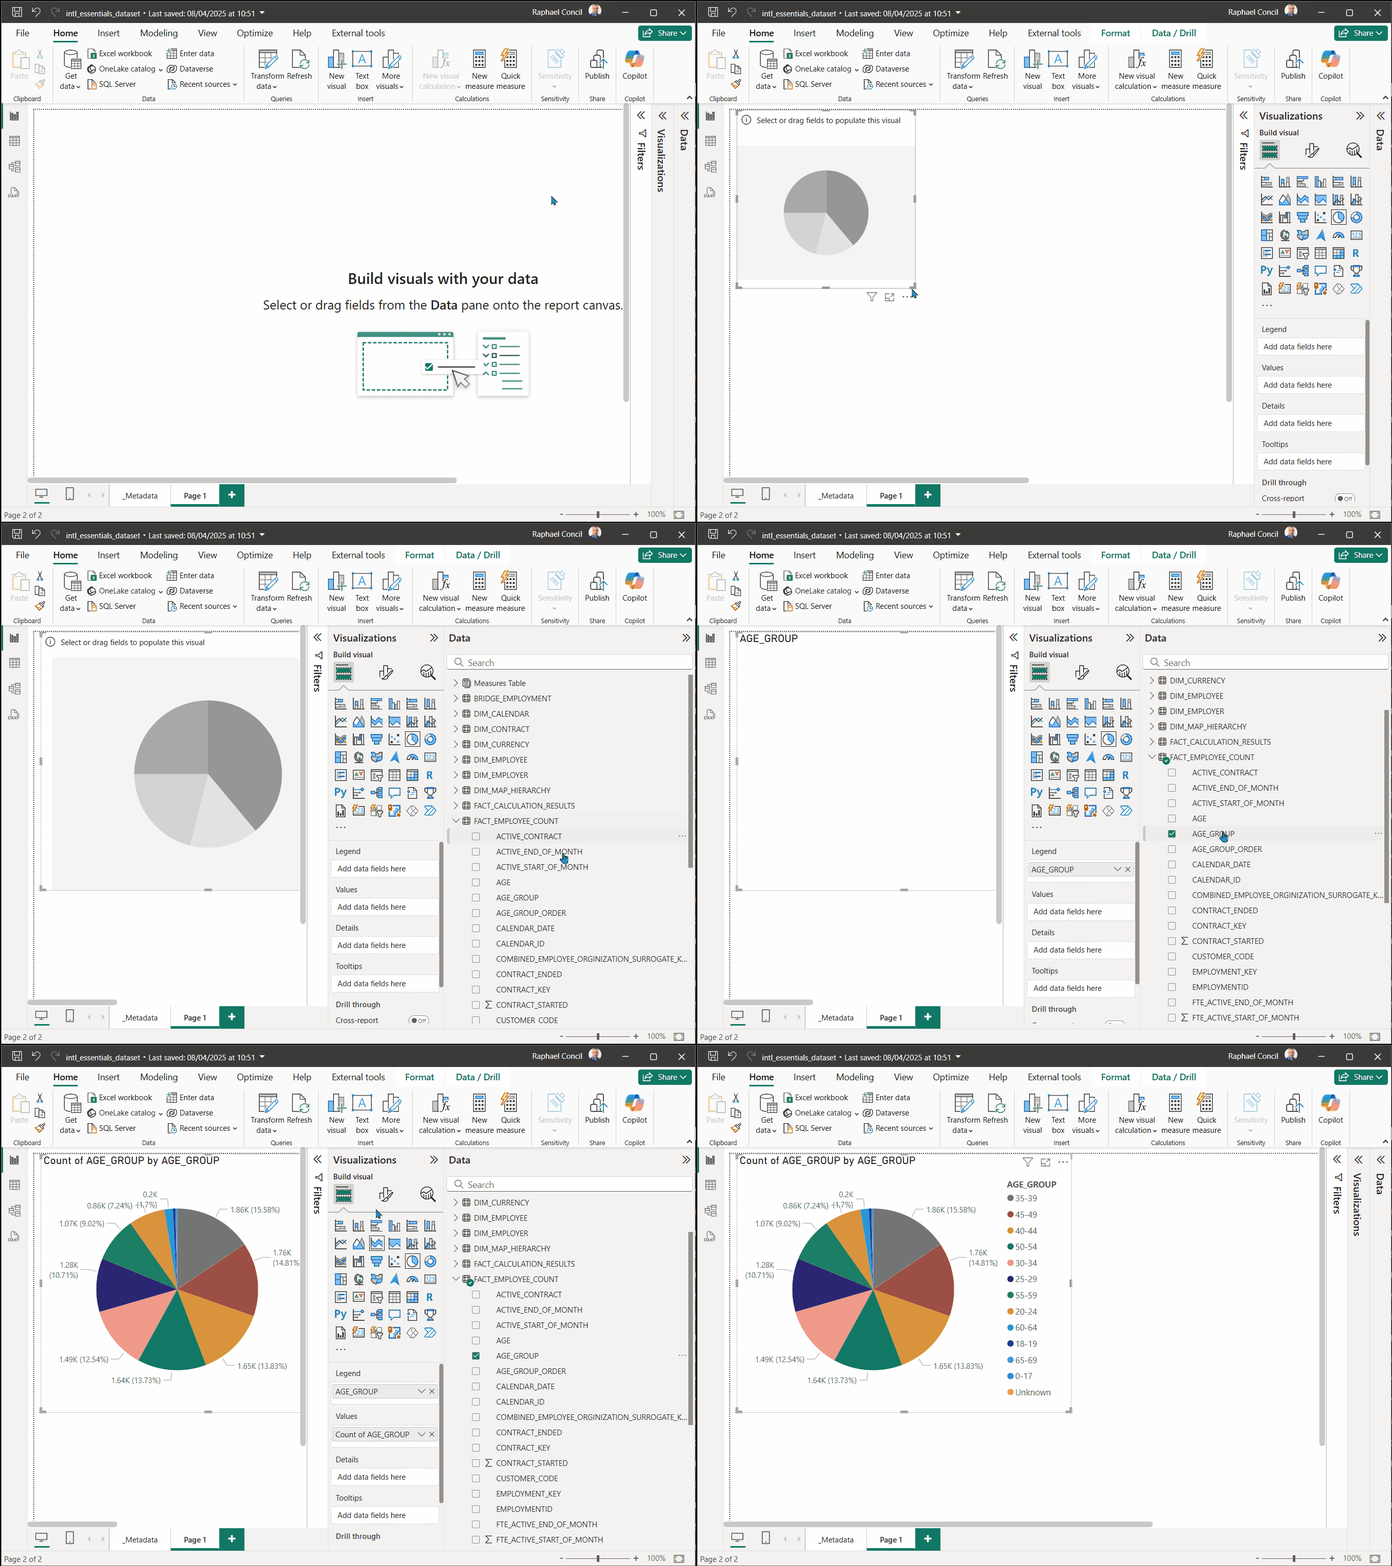
Treemap
Size of the space inside each rectangle on the measured value
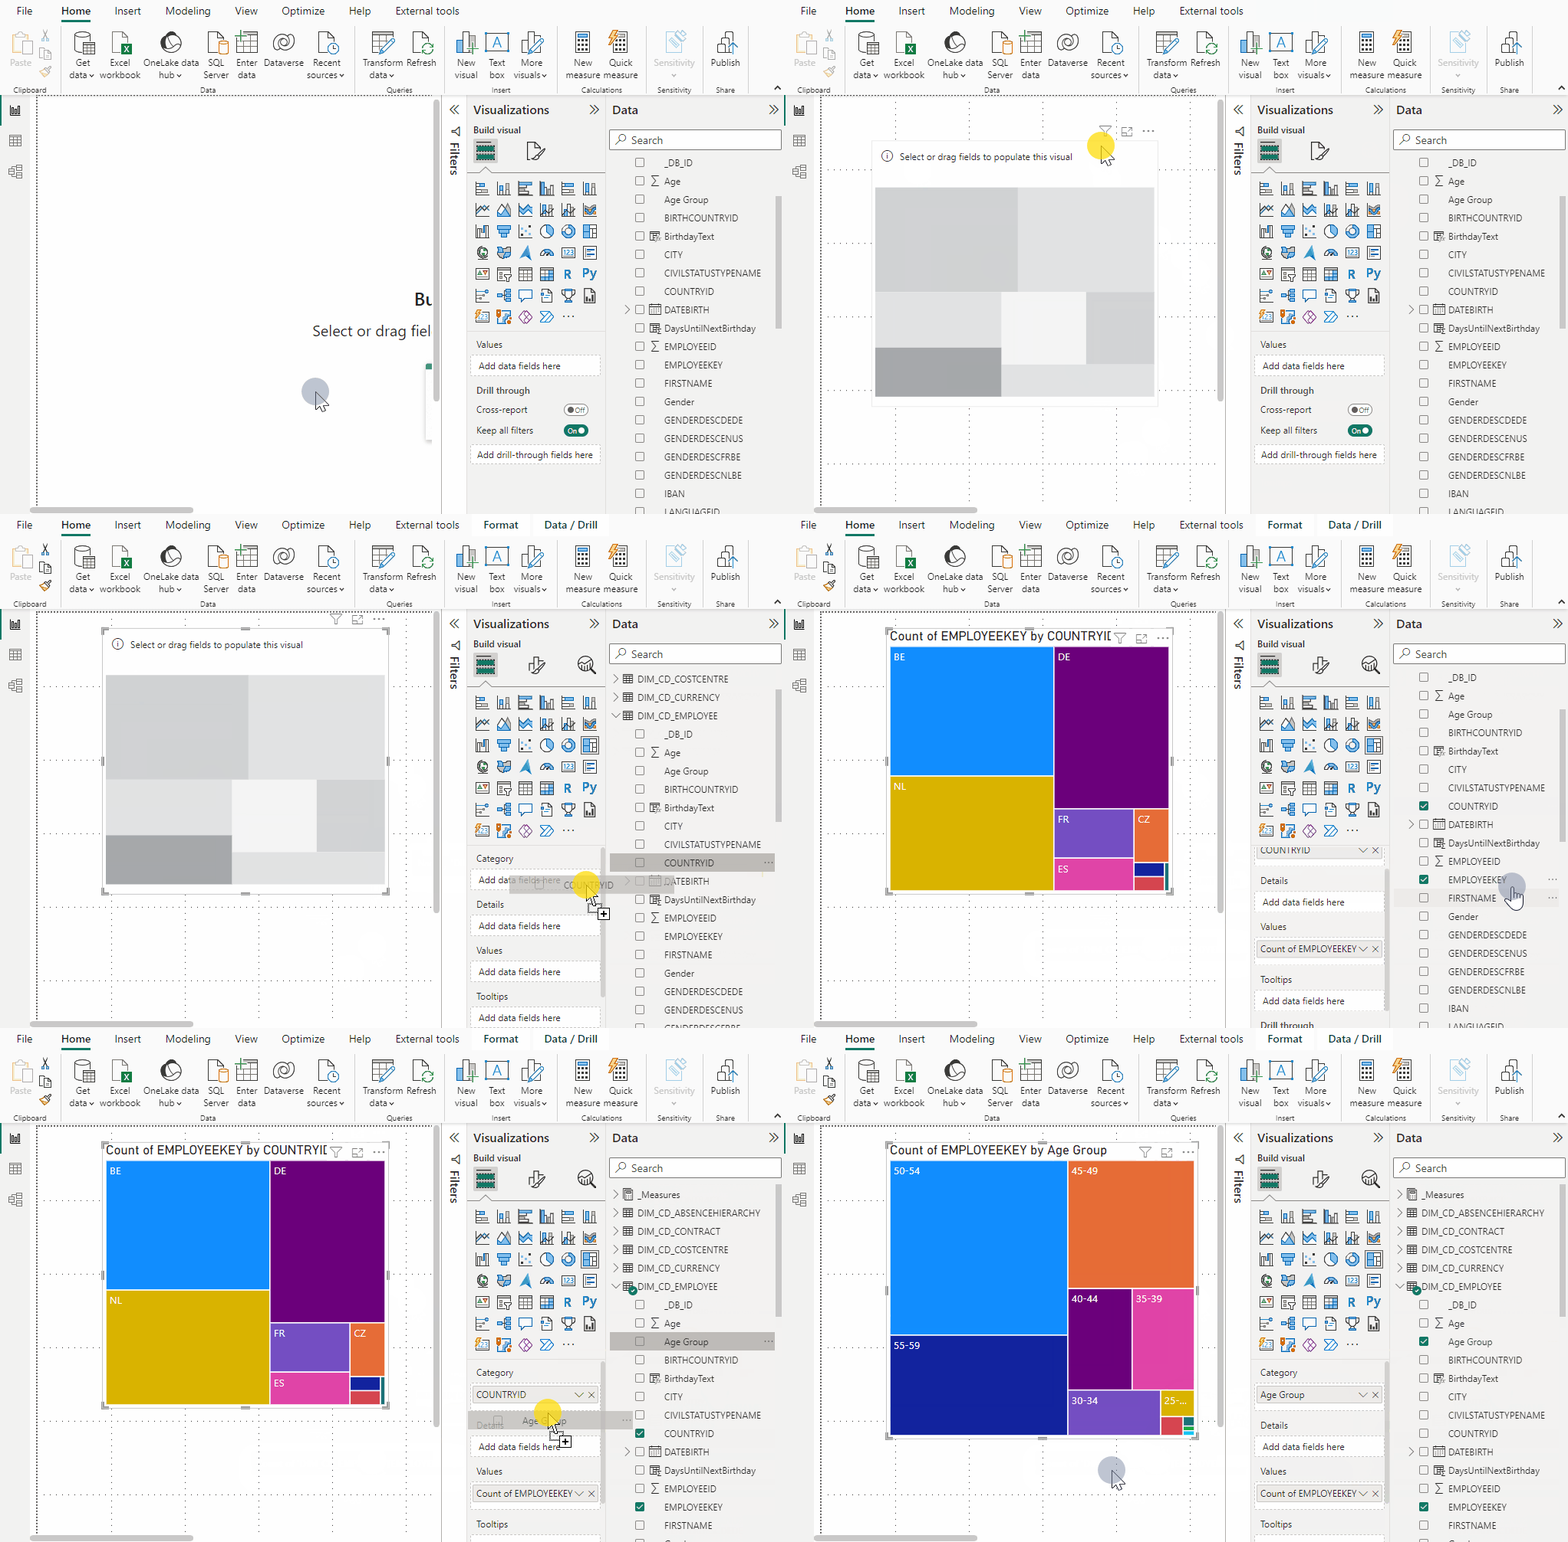
Gauge
Illustrates a KPIs current value and goal or target value
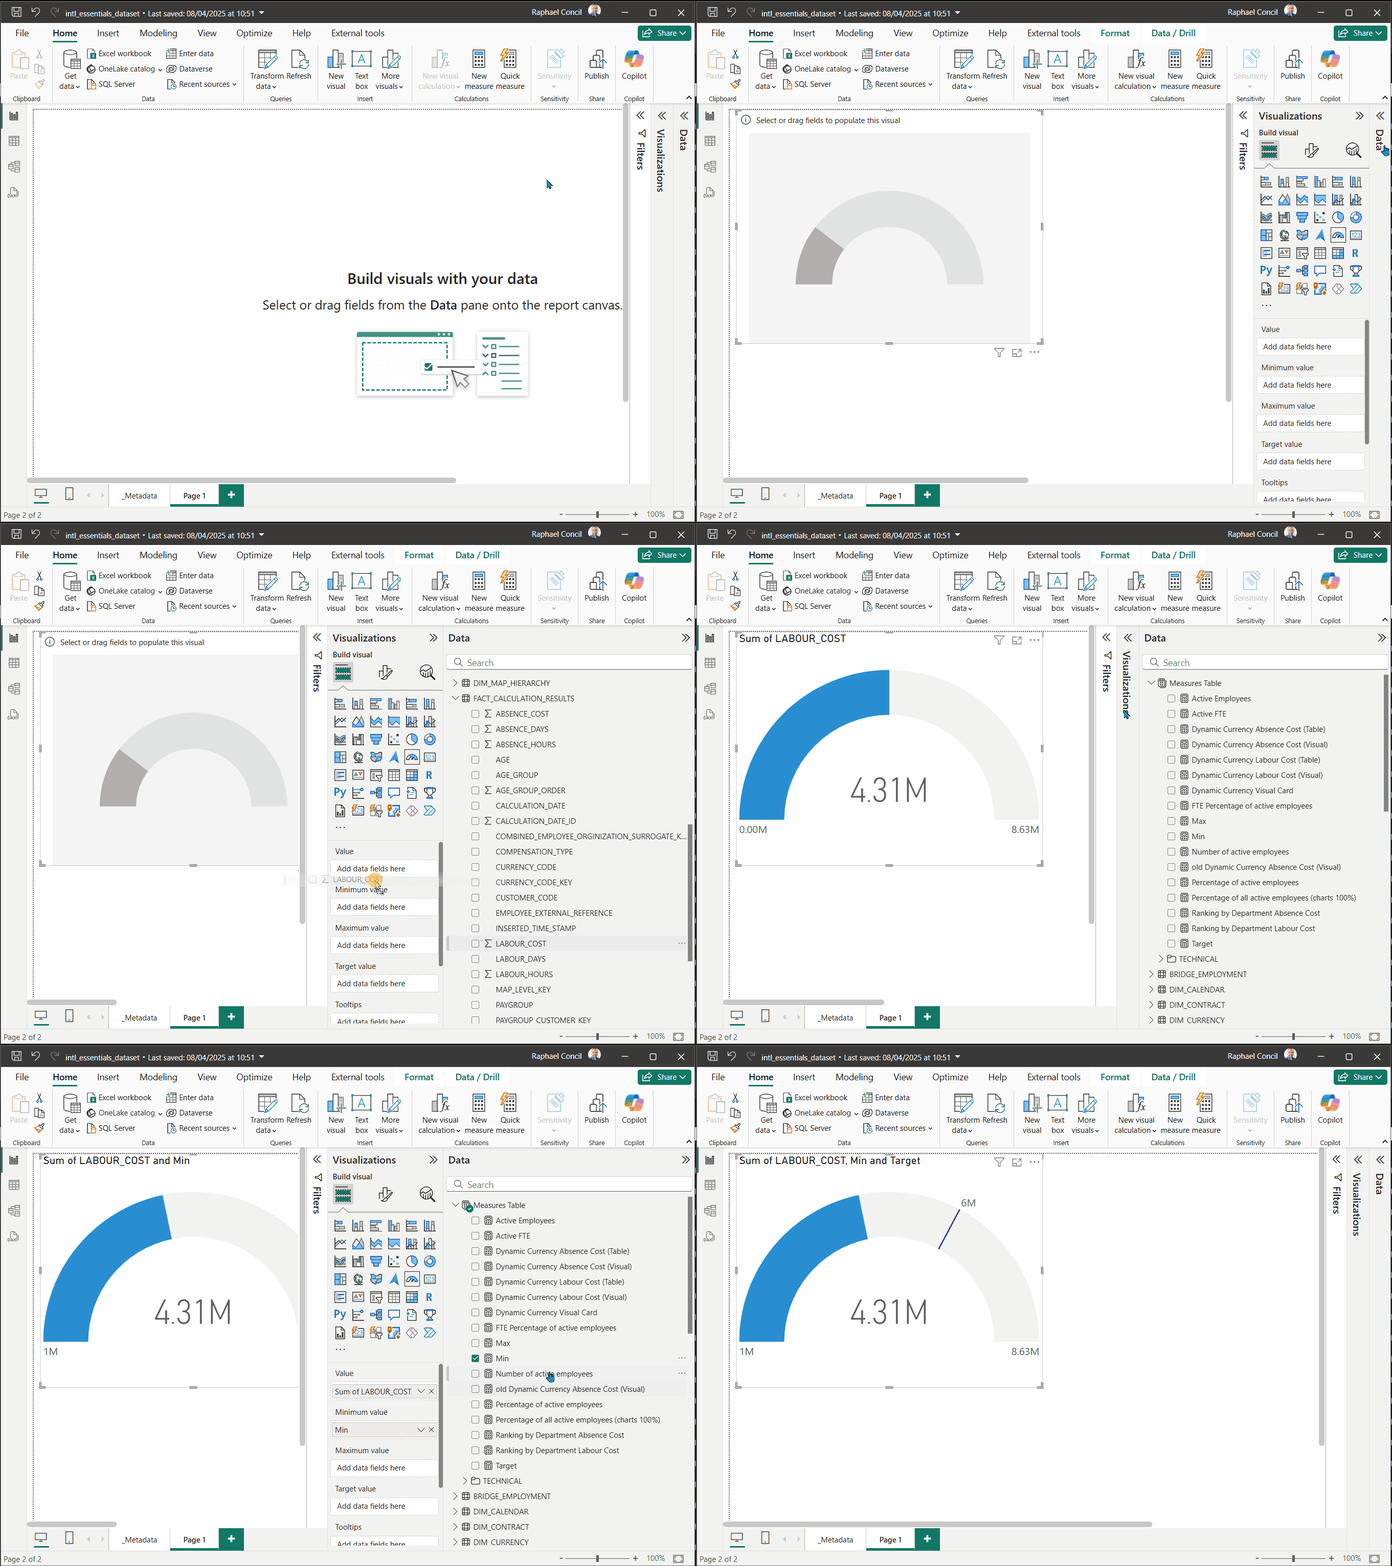
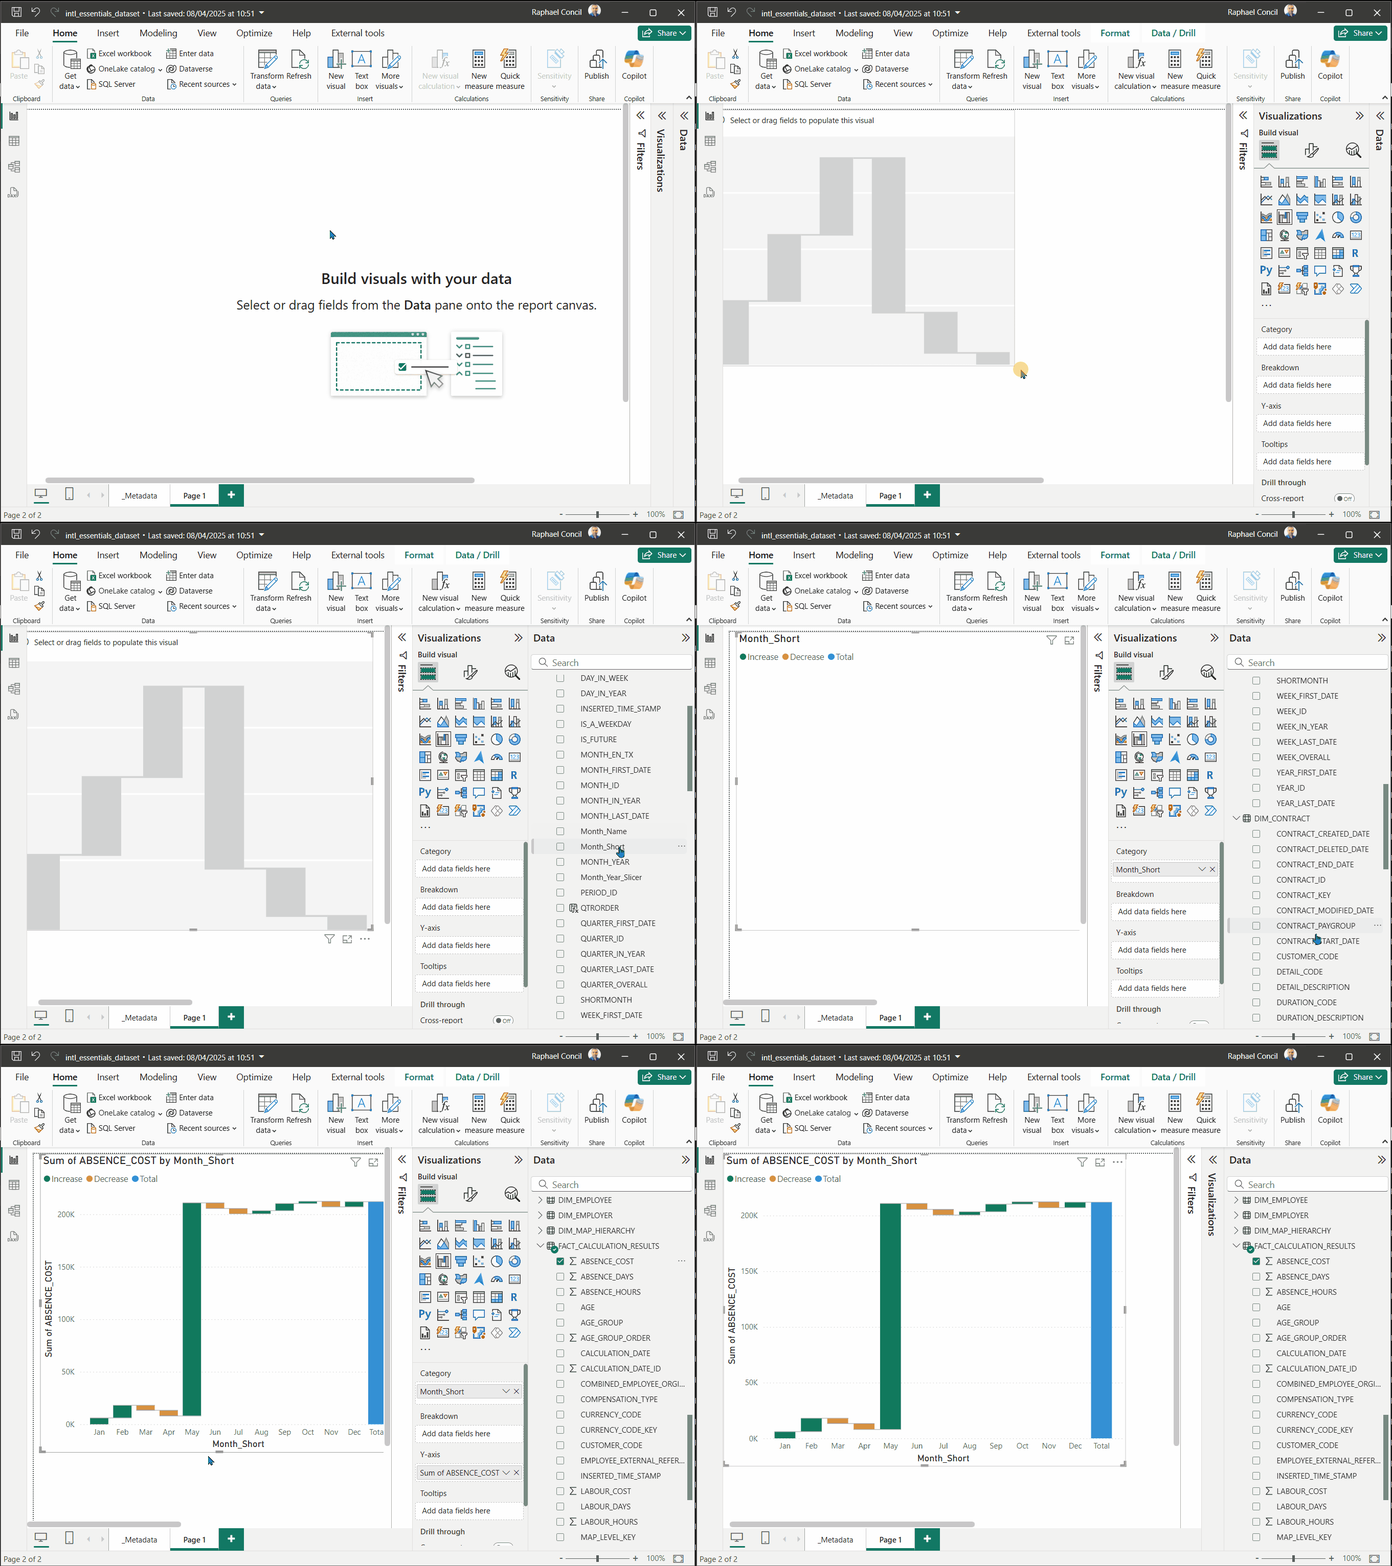
Waterfall Chart
To understand how an initial value is affected by a series of positive and negative changes.
